Run client infrastructurelike a coordinated control room.
Infradock unifies monitoring, diagnostics, and operational controls so your team can detect issues, act fast, and verify outcomes from one command surface.
MTTR Focus
Monitor → Diagnose → Fix
Workspaces
Client-Isolated Contexts
Ops Access
Terminal + Service Control
Incident Queue
7 Open
2 critical, 5 warning
Coverage
242 Domains
238 SSL monitored
Action Velocity
13 Fixes Today
Median closure: 18m
Recent Operational Events
Risk Concentration
Real interfaces for the full ops lifecycle
From portfolio-level visibility to low-level fixes, these are direct screenshots of Infradock workflows using representative infrastructure data.
Command Center
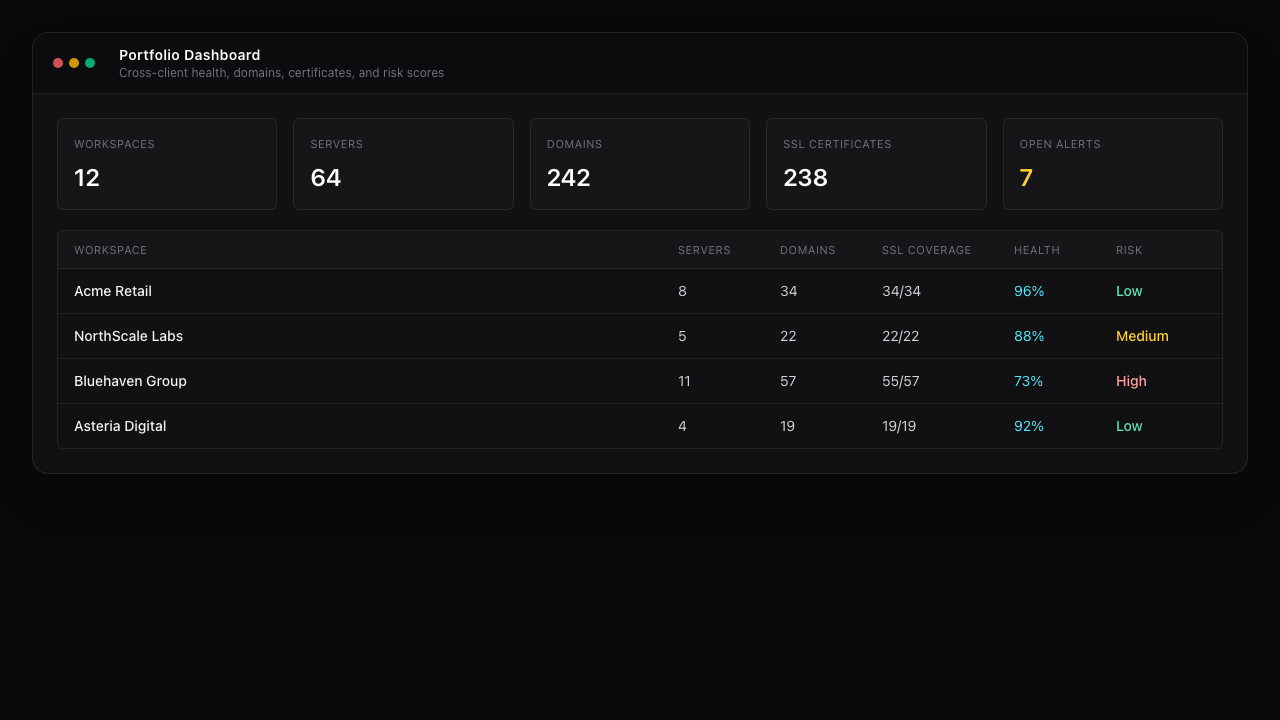
Portfolio Dashboard
Single view across workspaces with server, domain, SSL, health, and risk context.
Surface Navigator
A closed control loop your team can repeat daily
Infradock is designed around a deterministic incident flow: signal detection, context-rich diagnosis, and direct action.
Detect
Catch failures early with monitor, SSL, and server signals tied to each workspace.
Diagnose
Open logs, service states, and infrastructure context without switching tools.
Act
Use terminal, files, and control actions to restore service and confirm impact.
Built to cover observe, control, and investigation paths
Instead of forcing separate tools for each task category, Infradock layers these capabilities into one cohesive operator interface.
Observe
Control
Investigate
Coordinate
Designed for teams responsible for infrastructure outcomes
If your organization must keep client infrastructure reliable, this model helps reduce reaction time and coordination overhead.
Agencies
Many clients, shared operations team
Operate multiple client stacks from one cockpit while preserving workspace boundaries and role-based access.
MSPs
Service quality and response time pressure
Standardize monitor-to-fix workflows so teams can handle more infrastructure without expanding headcount linearly.
Lean Infra Teams
Small team, broad ownership
Unify observability and control actions in a single UI to reduce tool switching during incidents and routine maintenance.
Loading pricing...
Frequently Asked Questions
Operational details teams ask before adopting Infradock.